Software: Overview
How to load hivetool on the Pi provides detailed installation instructions. This project uses Free and Open Source Software (FOSS). The operating system is Linux although everything should run under Microsoft Windows. The code is available at GitHub.
There are several ways hivetool can be used:
- Data logger that provides data acquisition and storage.
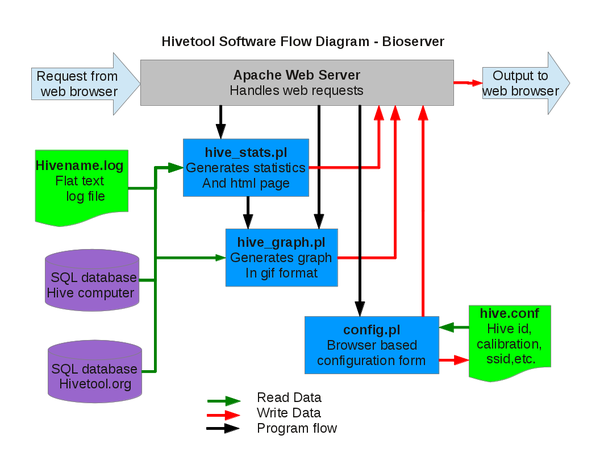
- Bioserver that displays, streams and analyzes the data in addition to data acquisition and storage.
Both of these options can be run with or without access to the internet. The bioserver requires additional software and configuration of a webserver (usually apache), the perl module GD::Graph, and perhaps a media server such as Icecast http://www.icecast.org/ or FFserver http://www.ffmpeg.org/ffserver.html to stream audio and video.
The Perl module GD::Graph is used to plot the data. The graphs and data are displayed with a web server, usually Apache. More detailed installation instructions are on the Forums.
Contents
Data Logger
Linux Distributions
Linux distros that have been tested are:
- Debian Wheezy (Pi)
- Lubuntu (lightweight Ubuntu)
- Slackware 13.0
How to load hivetool on the Pi provides detailed instructions.
Reading the Sensors
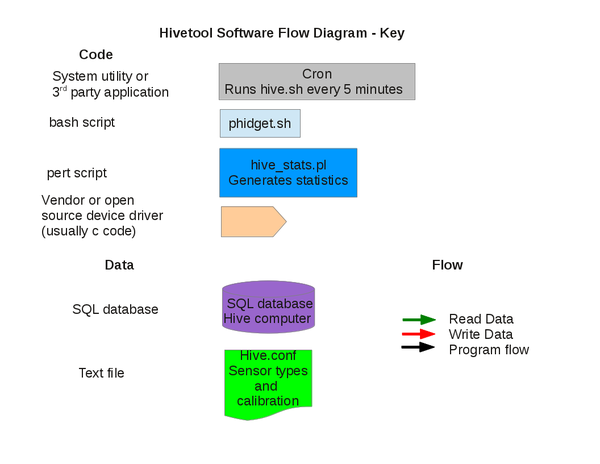
Every 5 minutes cron kicks off the bash script hive.sh that reads the sensors.
Scale
For tips on serial communication with the scale see Tips:Scale Talking to the scale is straight forward. Usually send a short character string to the scale and listen for a reply. For the Adam Equipment:
echo "N\r\n" > /dev/ttyS0
read -t 1 SCALE < /dev/ttyS0
To use the Cisco Linksys WRT160NL wireless router to talk to the My Weigh HD300 scale, first detach a process that sleeps for a second and sends a carriage return. Then read the data. The detached bit sleeps for a second, allowing the read to get latched onto the serial port, and then sends the command, which promptly returns data.
'sleep 1;echo -e "\r" > /dev/ttyUSB0' &
read -t 3 SCALE /dev/ttyUSB0.
Temperature Sensors
TEMPered reads the RDing TEMPerHUM USB thermometer/hygrometer. Source code is at github.com/edorfaus/TEMPered Detailed instructions for installing TEMPered on the Pi.
Logging the Data
After hive.sh reads the sensors, the data is appended to a flat text log file hive.log and written in xml format to the temporary file hive.xml. cURL is used to send the xml file to a hosted web server where a perl script extracts the xml encoded data and inserts a row into the database.
Bioserver
Just as a mail server servers up email and a web server dishes out web pages, a biological data server, or bioserver, serves biological data that it has monitored, analyzed and visualized.
Graphing the Data
GD::Graph
The Perl module GD::Graph is used to plot the data.


