Difference between revisions of "Bee counter software"
(→Summary) |
|||
| Line 18: | Line 18: | ||
When a track (series of brown dots for a single bee) is counted, it will turn green (out) or red (in) as it is counted, just before it is erased. | When a track (series of brown dots for a single bee) is counted, it will turn green (out) or red (in) as it is counted, just before it is erased. | ||
| − | Processing steps for each frame | + | The contour and track colors are based on the area of the contours. The number of bees is estimated by dividing the contour area by an arbitrary bee size. The area depends on how tightly the bee are grouped and settings that affect the size of the contours. |
| + | |||
| + | <table border=1> | ||
| + | <th>Number</th><th>Color</th> | ||
| + | <tr><td>1 bee</td><td bgcolor="Brown">Brown</td></tr> | ||
| + | <tr><td>2 bees</td><td bgcolor="orange">Orange</td></tr> | ||
| + | <tr><td>3 bees</td><td bgcolor="yellow">Yellow</td></tr> | ||
| + | <tr><td>4 bees</td><td bgcolor="blue">Blue</td></tr> | ||
| + | <tr><td>5 bees</td><td bgcolor="violet">Violet</td></tr> | ||
| + | </table> | ||
| + | |||
| + | ==Processing steps for each frame== | ||
#Convert image to grey scale. | #Convert image to grey scale. | ||
#[http://docs.opencv.org/doc/tutorials/imgproc/threshold/threshold.html?highlight=threshold Threshold] based on grey value. Result is binary image where dark areas are 0s and light areas are 1s. | #[http://docs.opencv.org/doc/tutorials/imgproc/threshold/threshold.html?highlight=threshold Threshold] based on grey value. Result is binary image where dark areas are 0s and light areas are 1s. | ||
| Line 30: | Line 41: | ||
#When the track ends, increment the IN or OUT counter depending on where the track starts, ends and length. | #When the track ends, increment the IN or OUT counter depending on where the track starts, ends and length. | ||
| − | |||
| − | |||
| − | |||
| − | |||
| − | |||
| − | |||
| − | |||
| − | |||
| − | |||
| − | |||
==Background== | ==Background== | ||
Revision as of 06:05, 21 March 2015
Summary
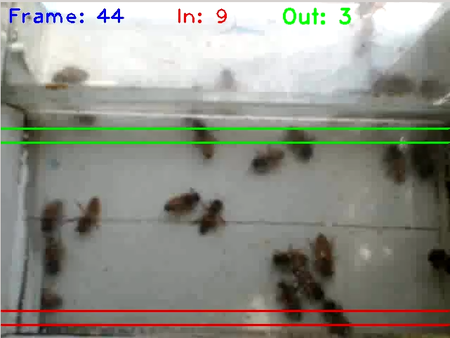
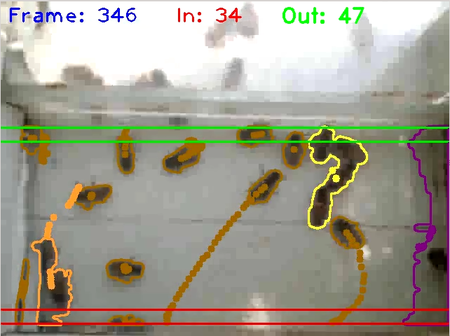
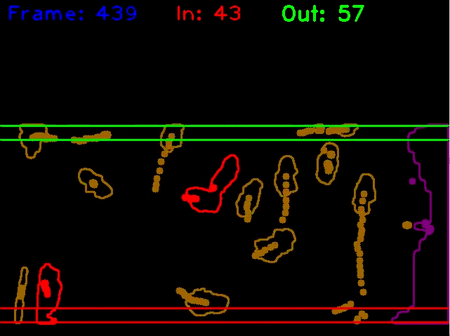
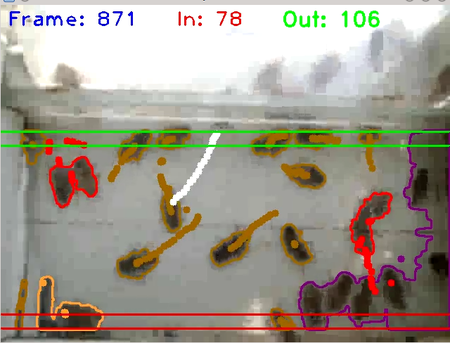
beeTrack1 is a c++ program using openCV libraries. Here is an example of it processing video:
http://hivetool.org/counter/beeTrack1_2.mp4
At frame 500, the contours are turned off, showing only the tracks. At 700, the input image (background) is turned off, showing only the contours and tracks.
When a track (series of brown dots for a single bee) is counted, it will turn green (out) or red (in) as it is counted, just before it is erased.
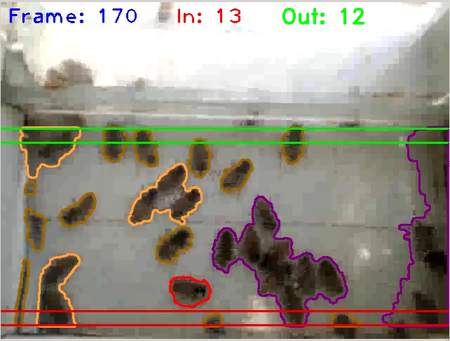
The contour and track colors are based on the area of the contours. The number of bees is estimated by dividing the contour area by an arbitrary bee size. The area depends on how tightly the bee are grouped and settings that affect the size of the contours.
| Number | Color |
|---|---|
| 1 bee | Brown |
| 2 bees | Orange |
| 3 bees | Yellow |
| 4 bees | Blue |
| 5 bees | Violet |
Processing steps for each frame
- Convert image to grey scale.
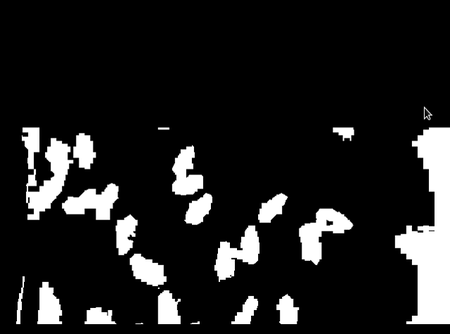
- Threshold based on grey value. Result is binary image where dark areas are 0s and light areas are 1s.
- Invert threshold image so bees that were black (0) are now white (1).
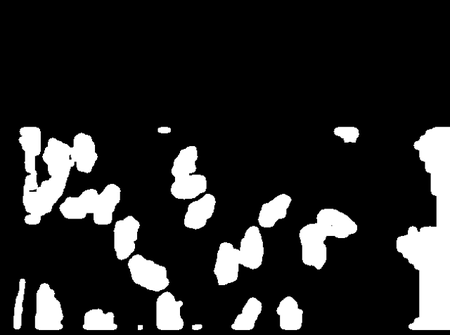
- Filter to smooth the noise. (The exact process changes from version to version but currently:
- Draw a color contour around each object and color code it based on size (area).
- Check each existing track to see if one falls within a contour of an object.
- If so, append the center coordinates of the object to the track. If not, start a new track.
- When the track ends, increment the IN or OUT counter depending on where the track starts, ends and length.
Background
Open Computer Vision (openCV) is an open source computer vision and machine learning software library. The library has more than 2500 optimized algorithms, which includes a comprehensive set of both classic and state-of-the-art computer vision and machine learning algorithms.
Kyle Hounslow has posted several YouTube videos on using openCV for motion tracking:
https://www.youtube.com/watch?v=X6rPdRZzgjg
Note that what most videos call tracking, is really just object identification. Tracking the object from frame to frame is trivial if there is only one object, but becomes harder and more error prone if there are multiple objects, especially if they can touch or occlude each other.
