Difference between revisions of "Software: Overview"
(→Weather) |
(→Reading the Sensors) |
||
| (22 intermediate revisions by 2 users not shown) | |||
| Line 1: | Line 1: | ||
| − | Software is continuously | + | Software is continuously developed (this page may become out of date). For detailed installation instructions, see '''[[Software: Install Hivetool Pi image|Install Hivetool Pi image]].'''<br> |
| − | + | This project uses [http://en.wikipedia.org/wiki/Free_and_open-source_software Free and Open Source Software (FOSS)]. The operating system is [http://en.wikipedia.org/wiki/GNU/Linux Linux] although everything should run under Microsoft Windows. The code is available at [https://github.com/hivetools GitHub]. | |
| − | For detailed installation instructions, see '''[[ | ||
Hivetool can be used as a: | Hivetool can be used as a: | ||
| Line 7: | Line 6: | ||
# Bioserver that displays, streams, analyzes and visualizes the data in addition to data acquisition and storage. | # Bioserver that displays, streams, analyzes and visualizes the data in addition to data acquisition and storage. | ||
| − | Both of these options can be run with or without access to the | + | Both of these options can be run with or without access to the Internet. The bioserver requires installation and configuration of additional software: a web server (usually Apache), the Perl module GD::Graph, and perhaps a media server such as [http://en.wikipedia.org/wiki/Icecast IceCast] http://www.icecast.org/ or [http://en.wikipedia.org/wiki/FFmpeg FFserver] http://www.ffmpeg.org/ffserver.html to record and/or stream audio and video. The Pi uses VLC media software to stream video. |
==Linux Distributions== | ==Linux Distributions== | ||
| Line 23: | Line 22: | ||
=== Initialization=== | === Initialization=== | ||
| − | Starting with Hivetool ver 0.5, the text file hive.conf is first | + | Starting with Hivetool ver 0.5, the text file hive.conf is read first to determine which sensors are used and to retrieve their calibration parameters. |
=== Reading the Sensors === | === Reading the Sensors === | ||
| + | A detailed list of supported sensors is on the [[Sensors|Sensors]] page. | ||
====Hive Weight==== | ====Hive Weight==== | ||
| Line 34: | Line 34: | ||
tempered reads the RDing TEMPerHUM USB thermometer/hygrometer. Source code is at | tempered reads the RDing TEMPerHUM USB thermometer/hygrometer. Source code is at | ||
github.com/edorfaus/TEMPered [http://hivetool.net/node/59 Detailed instructions for installing TEMPered on the Pi.] | github.com/edorfaus/TEMPered [http://hivetool.net/node/59 Detailed instructions for installing TEMPered on the Pi.] | ||
| + | dht22 reads the DHT22 temperature/humidity sensor. | ||
| + | |||
| + | ==== Lux Sensors ==== | ||
| + | 2591 reads the TSL2591. | ||
====Weather==== | ====Weather==== | ||
| Line 40: | Line 44: | ||
=== Logging the Data === | === Logging the Data === | ||
| − | After hive.sh reads the sensors and gets the weather, the data is appended to a flat text log file [[hive.log]], | + | After hive.sh reads the sensors and gets the weather, the data is logged both locally and remotely on a central web server. On the hive computer it is appended to a flat text log file [[hive.log]], and to a SQL database and written in xml format to the temporary file [[/tmp/hive.xml]] by xml.sh. [[cURL]] is used to send the xml file to a hosted web server where a perl script extracts the xml encoded data and inserts a row into the database. |
| + | |||
| + | Starting with version 0,5, the data is also stored in a local SQL database. Unless a full SQL server is needed, SQLite is recommend as it uses less resources. | ||
| + | *sql.sh inserts a row into a MySQL database. | ||
| + | *sqlite.sh inserts a row into a SQLite database. | ||
== Bioserver == | == Bioserver == | ||
| Line 48: | Line 56: | ||
=== Visualizing the Data === | === Visualizing the Data === | ||
==== [[GD::Graph]] ==== | ==== [[GD::Graph]] ==== | ||
| − | The [http://search.cpan.org/dist/GDGraph/Graph.pm Perl module | + | The [http://search.cpan.org/dist/GDGraph/Graph.pm Perl module GD::Graph] is used to plot the data. The graphs and data are displayed with a web server, usually Apache. More detailed installation instructions are on the [http://hivetool.net/forum/1 Forums]. |
| + | |||
| + | ====Filters==== | ||
| + | Filters are used to remove "noise" and distortion from the data. | ||
| + | |||
| + | #[[NASA weight filter]] eliminates weight changes caused by the beekeeper so the data only reflects weight changes made by the bees. | ||
| + | |||
=== Displaying the Data === | === Displaying the Data === | ||
==== [[Apache Web Server]] ==== | ==== [[Apache Web Server]] ==== | ||
| − | When a request from a web browser comes in, the | + | When a request from a web browser comes in, the web server kicks off hive_stats.pl that queries the database for current, minimum, maximum, and average data values and generates the html page. Embedded in the html page is a image link to hive_graph.pl that queries the database for the detailed data and returns the data in tabular form for download or generates and returns the graph as a gif. hive_graph.pl can be called as a stand alone program to [[embed a graph]] in a web page on another site. |
=== [[Audio]] === | === [[Audio]] === | ||
| Line 58: | Line 72: | ||
==== ffserver ==== | ==== ffserver ==== | ||
=== [[Video]] === | === [[Video]] === | ||
| + | Directions for [[Video|streaming video from the Pi.]] | ||
| + | |||
| + | [[Media Server|Proposed Video Server.]] | ||
| + | |||
| + | ==Programmer's Guide== | ||
| + | ===Variable Naming Convention=== | ||
| + | If you wish to dig in to the code, you might want to start with the [[Variable Naming Convention]] guide. | ||
Latest revision as of 02:17, 22 March 2016
Software is continuously developed (this page may become out of date). For detailed installation instructions, see Install Hivetool Pi image.
This project uses Free and Open Source Software (FOSS). The operating system is Linux although everything should run under Microsoft Windows. The code is available at GitHub.
Hivetool can be used as a:
- Data logger that provides data acquisition and storage.
- Bioserver that displays, streams, analyzes and visualizes the data in addition to data acquisition and storage.
Both of these options can be run with or without access to the Internet. The bioserver requires installation and configuration of additional software: a web server (usually Apache), the Perl module GD::Graph, and perhaps a media server such as IceCast http://www.icecast.org/ or FFserver http://www.ffmpeg.org/ffserver.html to record and/or stream audio and video. The Pi uses VLC media software to stream video.
Linux Distributions
Linux distros that have been tested are:
- Debian Wheezy (Pi)
- Lubuntu (lightweight Ubuntu)
- Slackware 13.0
Data Logger
Scheduling
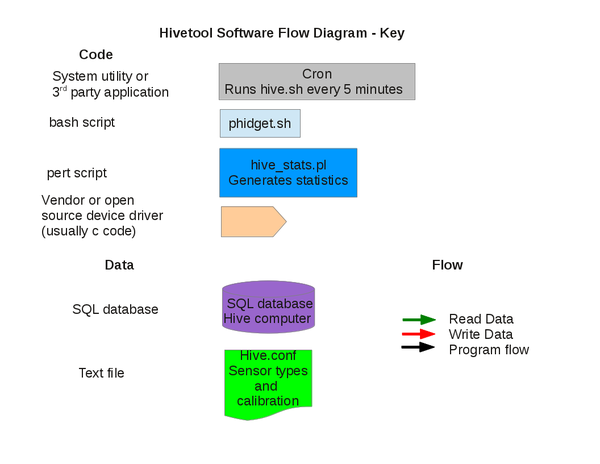
Every 5 minutes cron kicks off the bash script hive.sh that reads the sensors and logs the data.
Initialization
Starting with Hivetool ver 0.5, the text file hive.conf is read first to determine which sensors are used and to retrieve their calibration parameters.
Reading the Sensors
A detailed list of supported sensors is on the Sensors page.
Hive Weight
Several different scales are supported. For tips on scales that use serial communication see Scale Communication. Scales based on the HX711(see Frameless Scale or the AD7193 (Phidget Bridge) Analog to Digital Converter are supported on the Pi.
Temperature and Humidity Sensors
tempered reads the RDing TEMPerHUM USB thermometer/hygrometer. Source code is at github.com/edorfaus/TEMPered Detailed instructions for installing TEMPered on the Pi. dht22 reads the DHT22 temperature/humidity sensor.
Lux Sensors
2591 reads the TSL2591.
Weather
cURL is used to pull the local weather conditions from Weather Underground in xml format and write it to a temporary file, /tmp/wx.html. The data is parsed using grep and regular expressions.
Logging the Data
After hive.sh reads the sensors and gets the weather, the data is logged both locally and remotely on a central web server. On the hive computer it is appended to a flat text log file hive.log, and to a SQL database and written in xml format to the temporary file /tmp/hive.xml by xml.sh. cURL is used to send the xml file to a hosted web server where a perl script extracts the xml encoded data and inserts a row into the database.
Starting with version 0,5, the data is also stored in a local SQL database. Unless a full SQL server is needed, SQLite is recommend as it uses less resources.
- sql.sh inserts a row into a MySQL database.
- sqlite.sh inserts a row into a SQLite database.
Bioserver
Just as a mail server serves up email and a web server dishes out web pages, a biological data server, or bioserver, serves biological data that it has monitored, analyzed and visualized.
Visualizing the Data
GD::Graph
The Perl module GD::Graph is used to plot the data. The graphs and data are displayed with a web server, usually Apache. More detailed installation instructions are on the Forums.
Filters
Filters are used to remove "noise" and distortion from the data.
- NASA weight filter eliminates weight changes caused by the beekeeper so the data only reflects weight changes made by the bees.
Displaying the Data
Apache Web Server
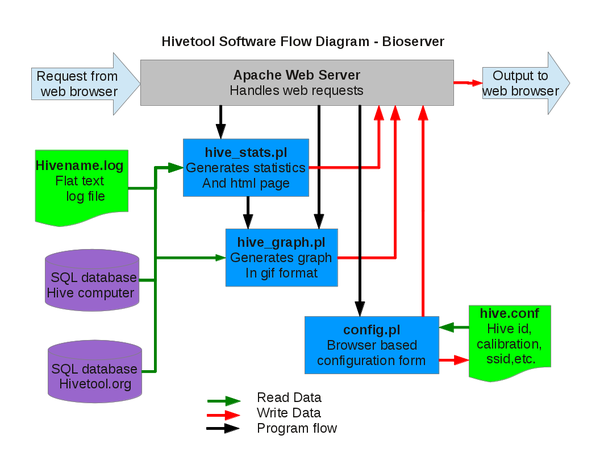
When a request from a web browser comes in, the web server kicks off hive_stats.pl that queries the database for current, minimum, maximum, and average data values and generates the html page. Embedded in the html page is a image link to hive_graph.pl that queries the database for the detailed data and returns the data in tabular form for download or generates and returns the graph as a gif. hive_graph.pl can be called as a stand alone program to embed a graph in a web page on another site.
Audio
IceCast
ffserver
Video
Directions for streaming video from the Pi.
Programmer's Guide
Variable Naming Convention
If you wish to dig in to the code, you might want to start with the Variable Naming Convention guide.


